Bangkok Index:

Cost of Living

2019 Rankings

MARKETS (prices in USD equivalent)

$6.44
Milk (1 gallon, regular)
$0.60
White rice (1 lb)
$2.53
Eggs (1 dozen)
$9.08
Local cheese (1 lb)
$1.37
Apples (1 lb)
$0.28
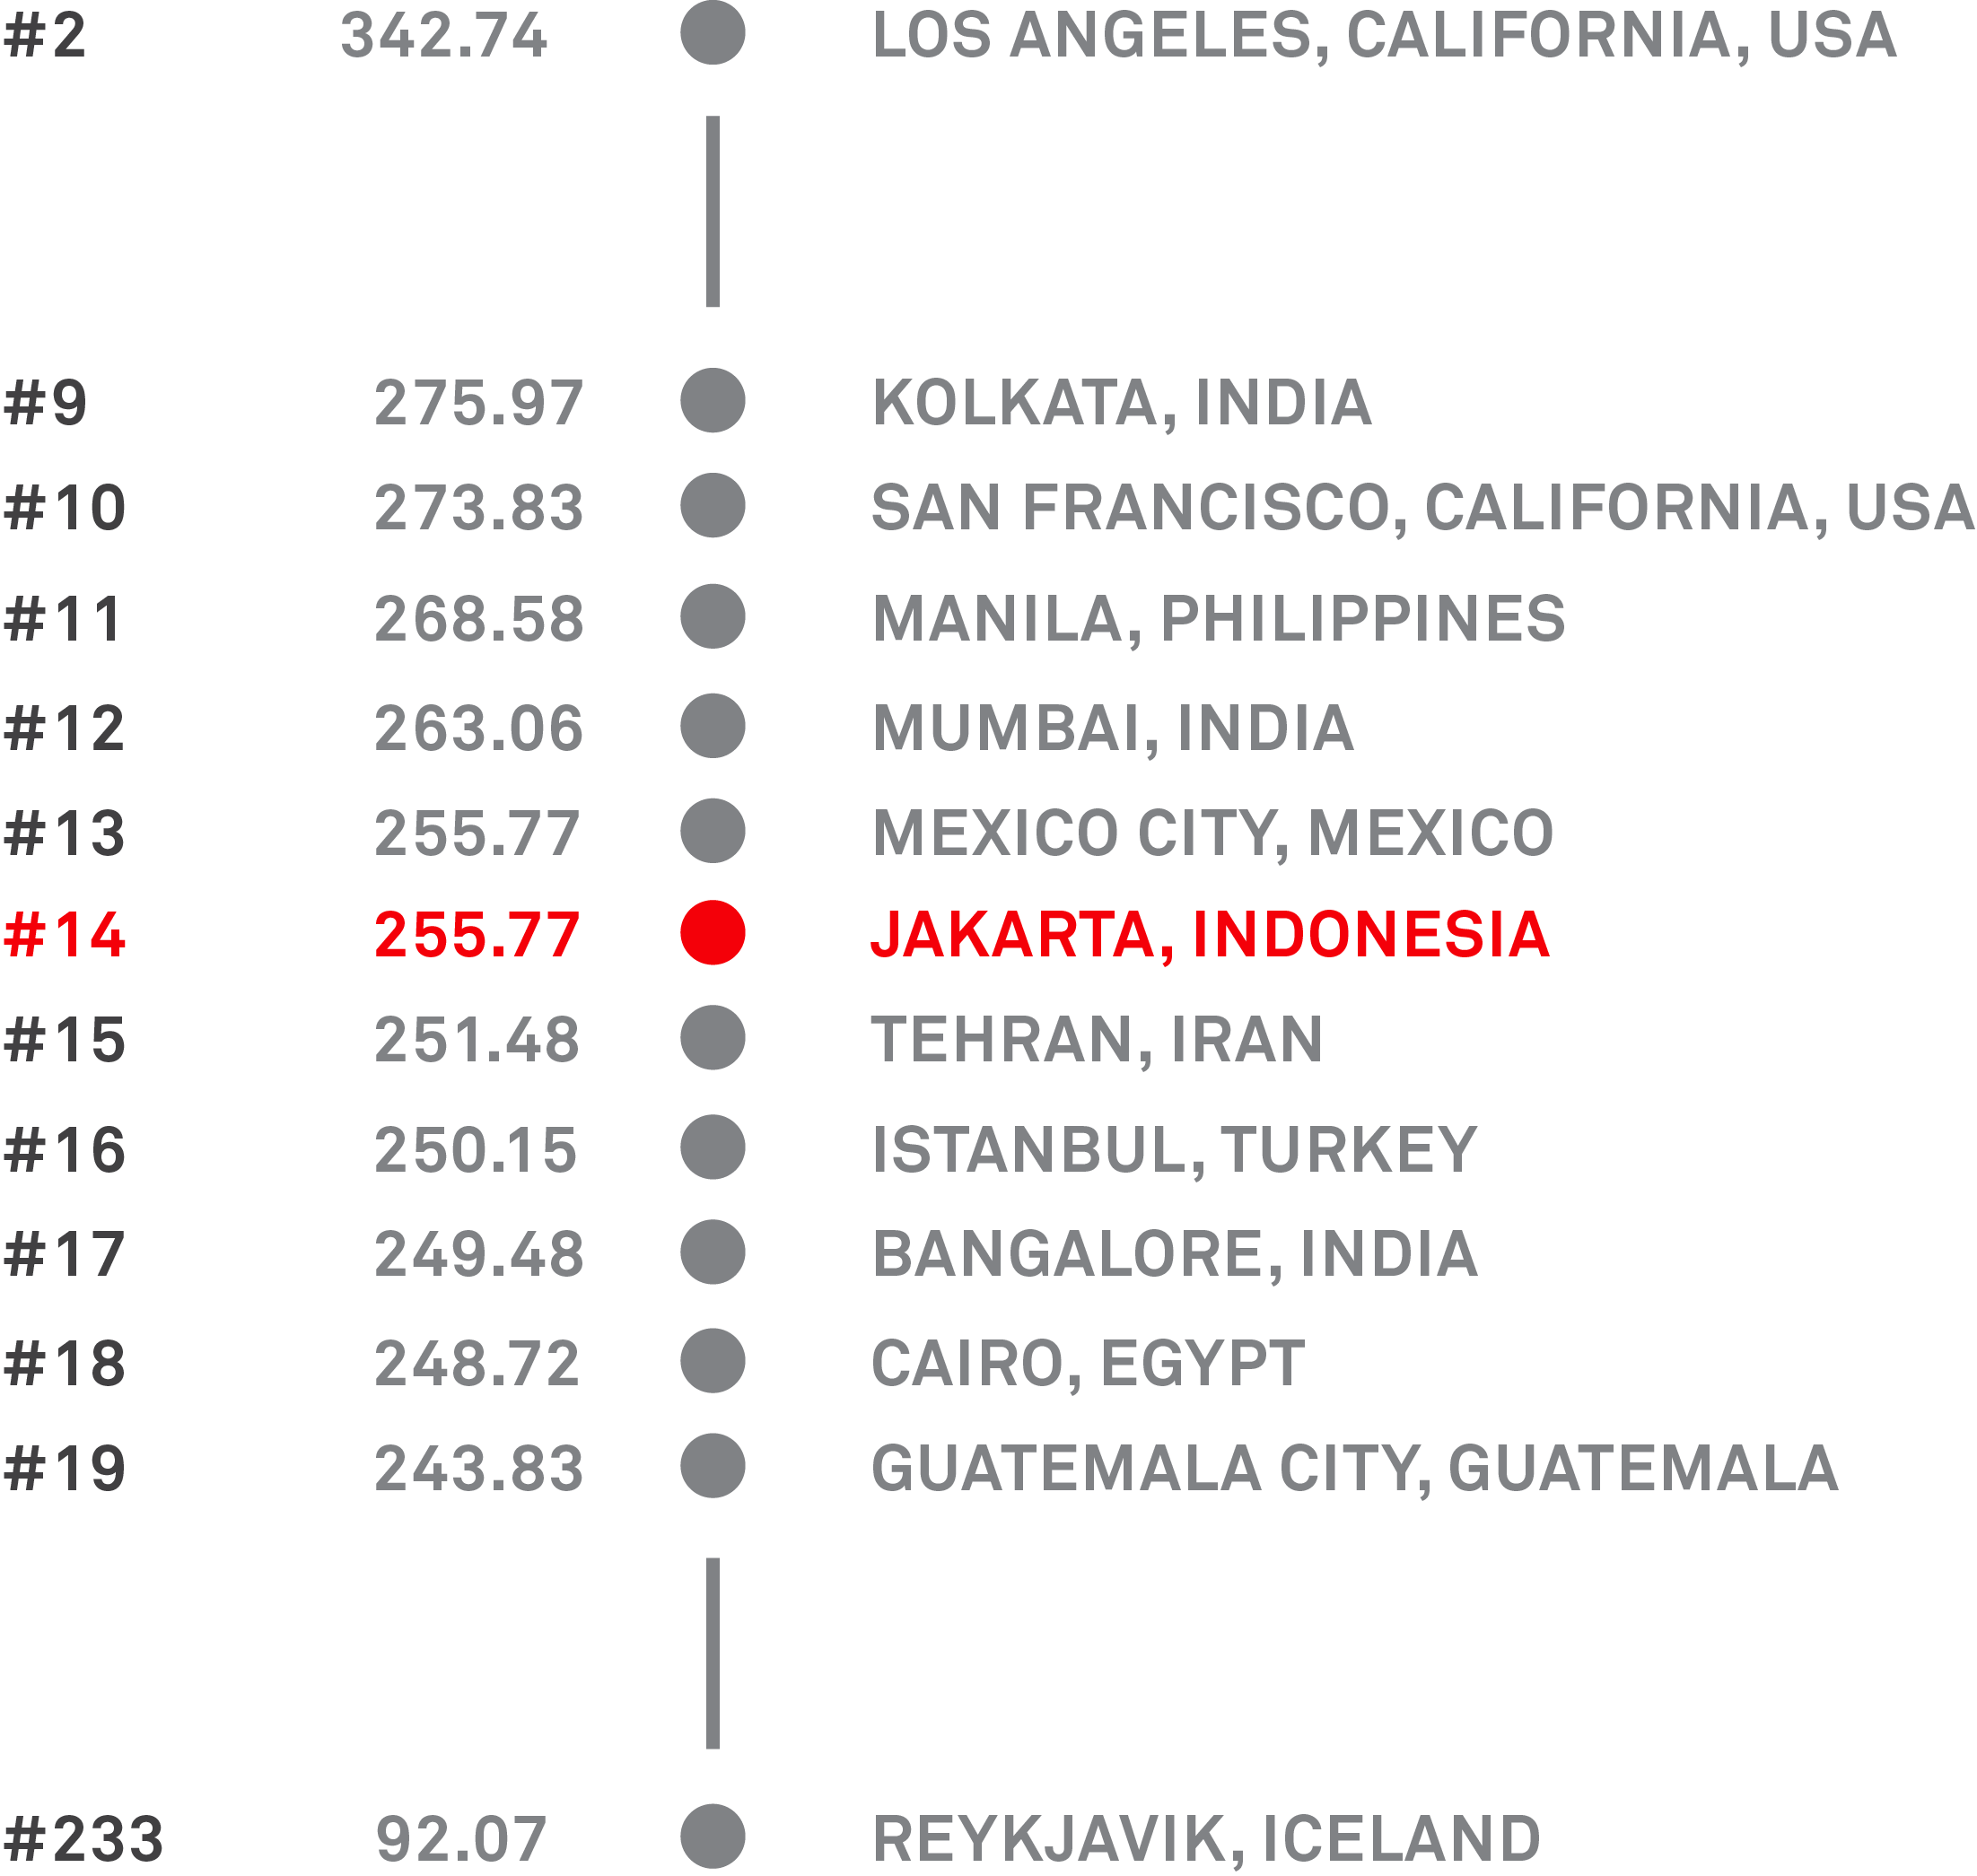
Water (12 oz bottle)

QUALITY OF LIFE INDEX (ranking out of 250 total cities)
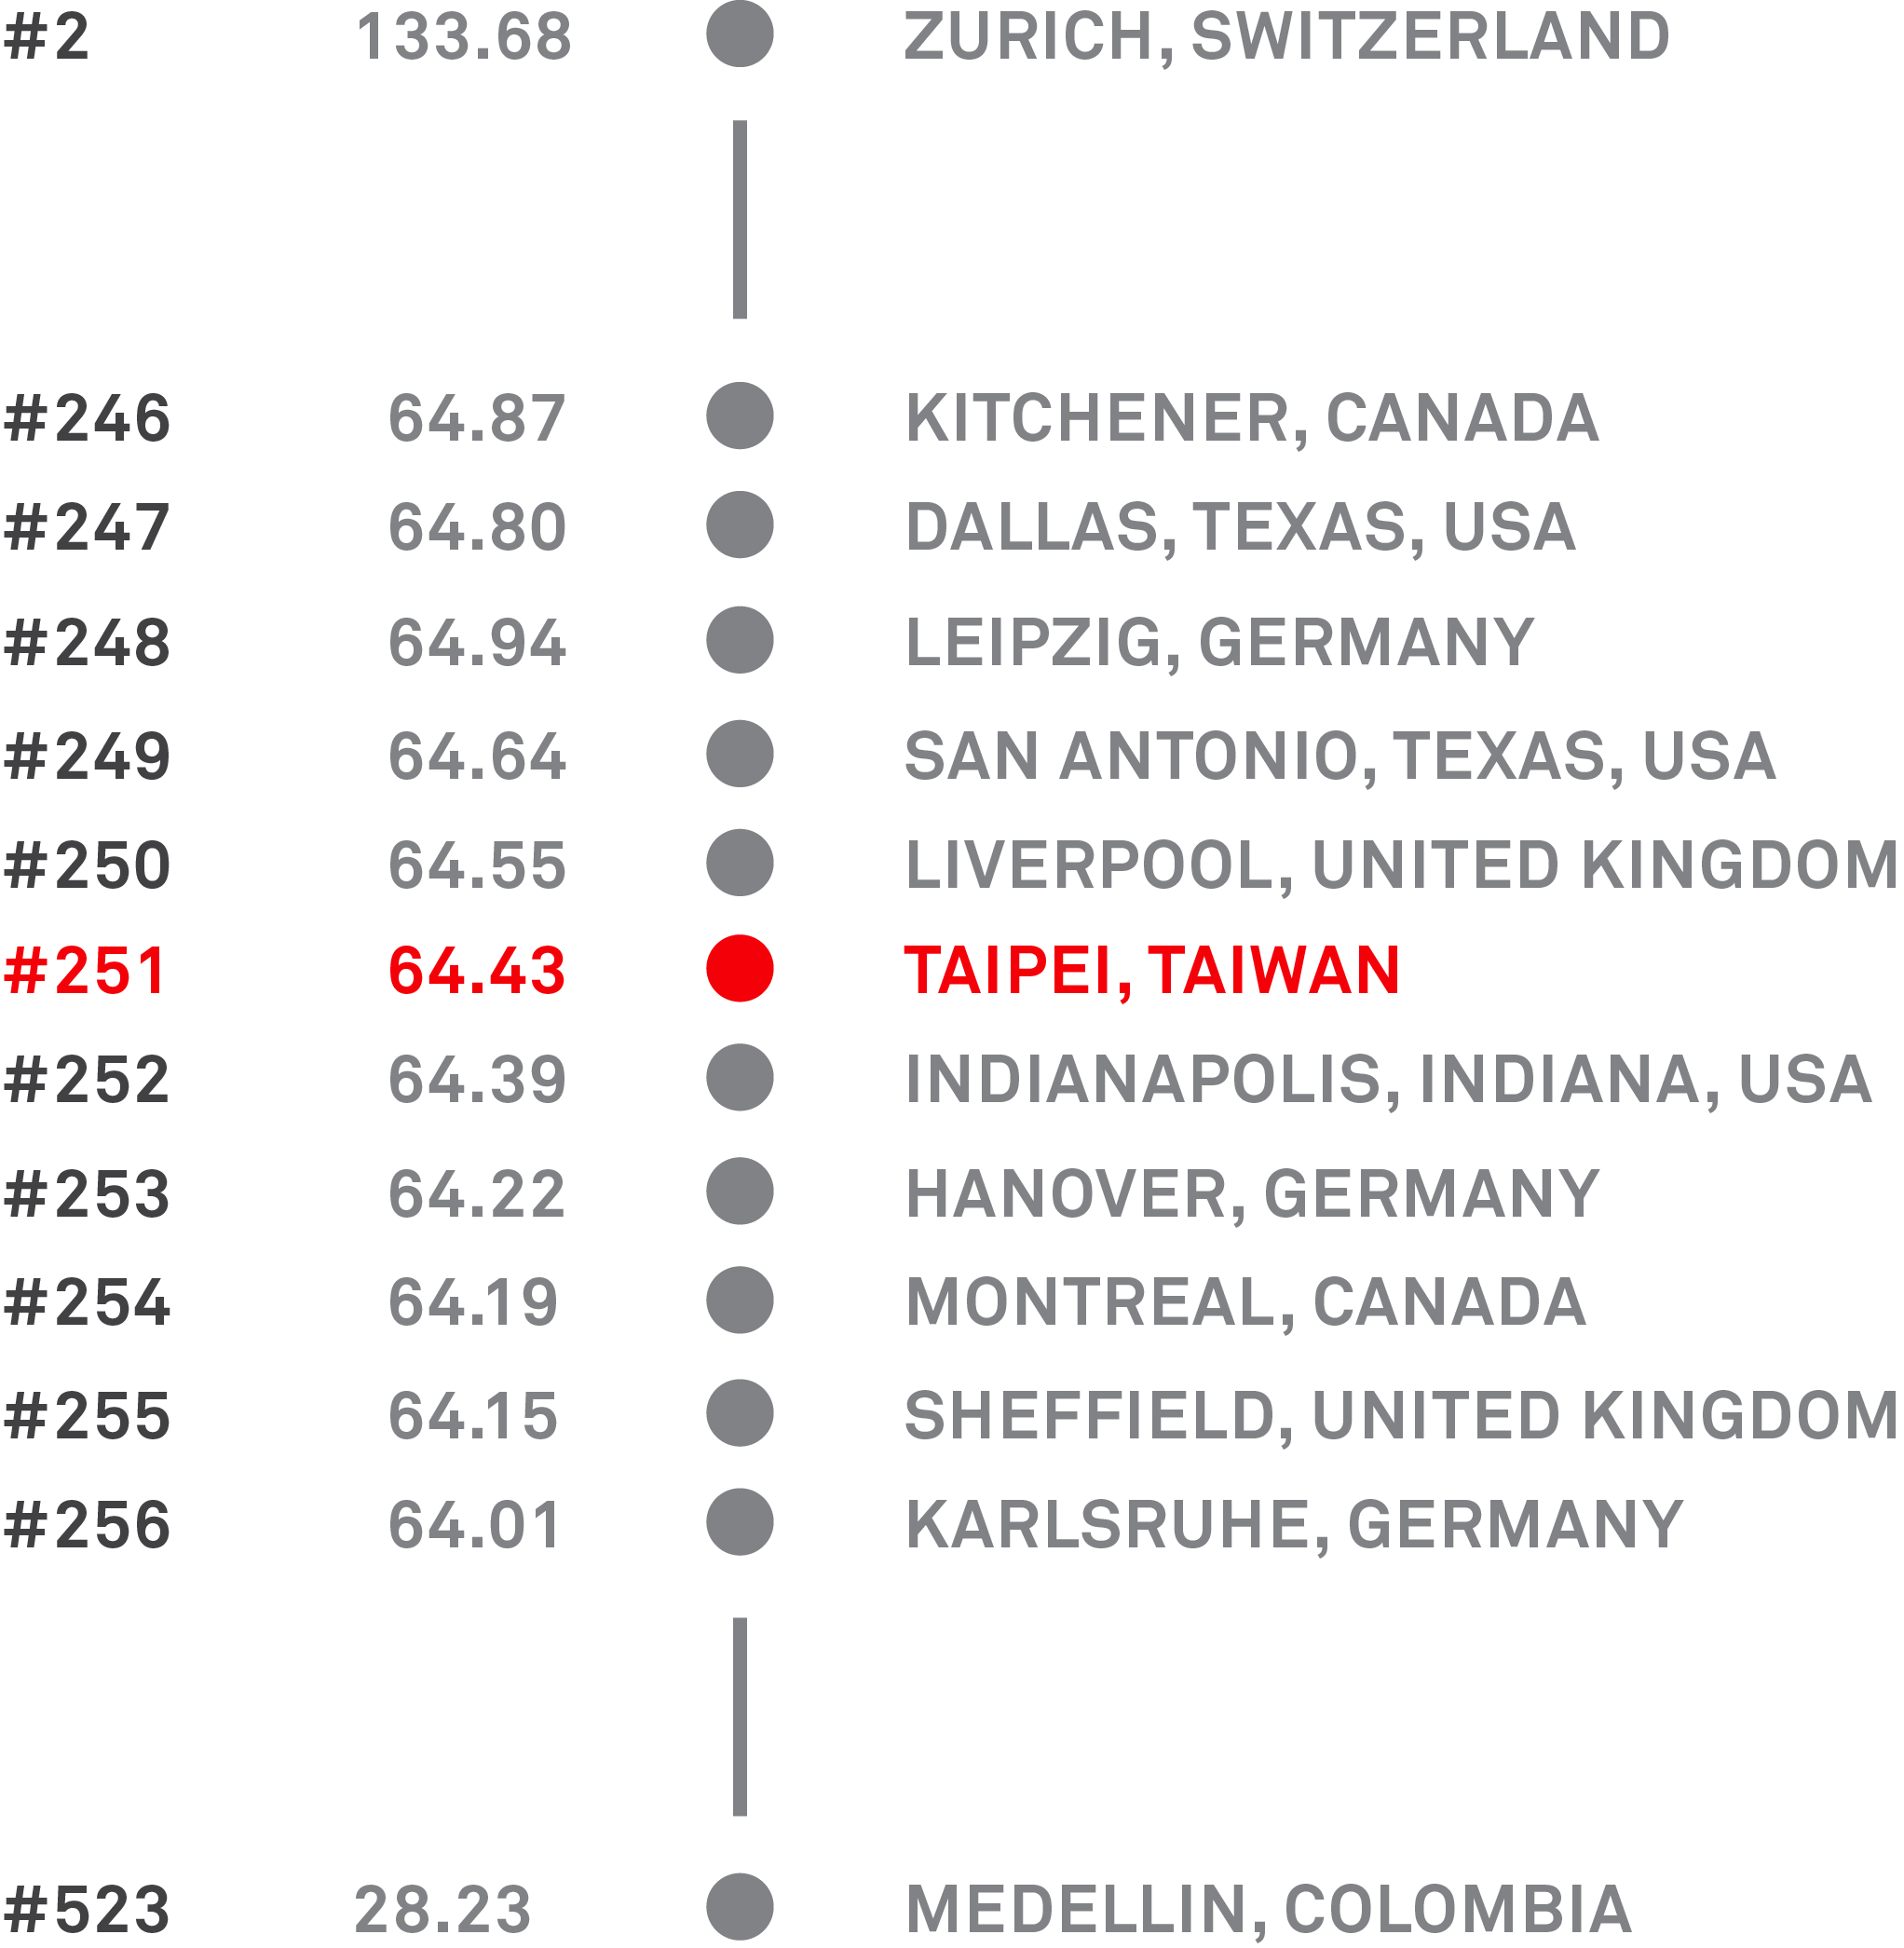
232

Graph showing Bangkok quality of life index ranking

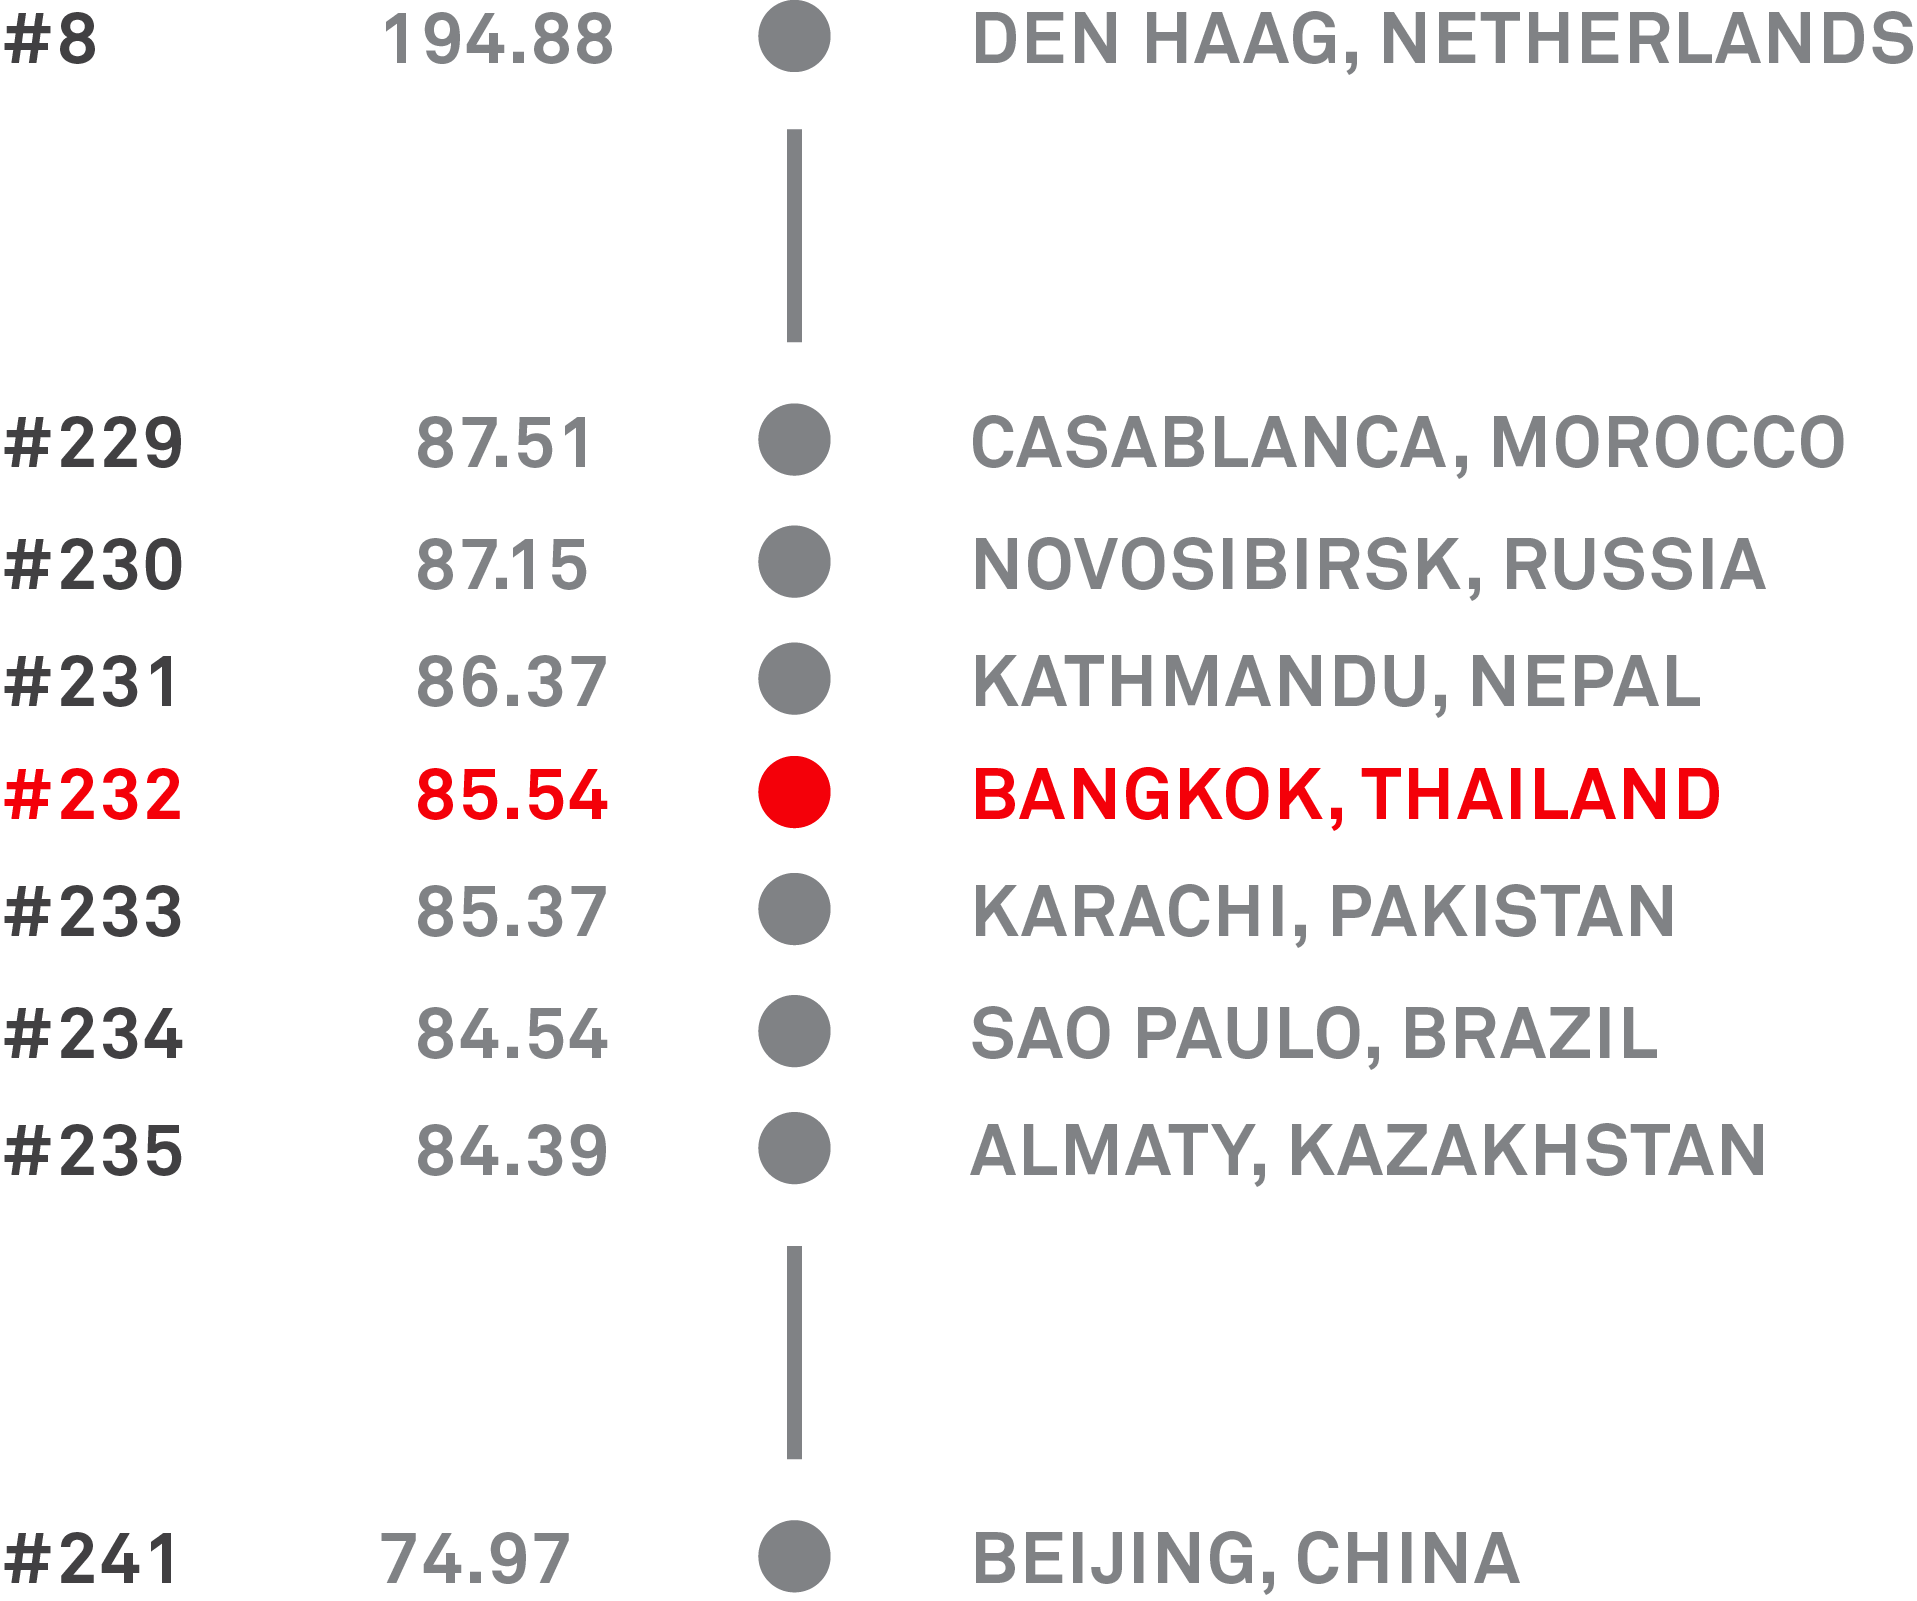
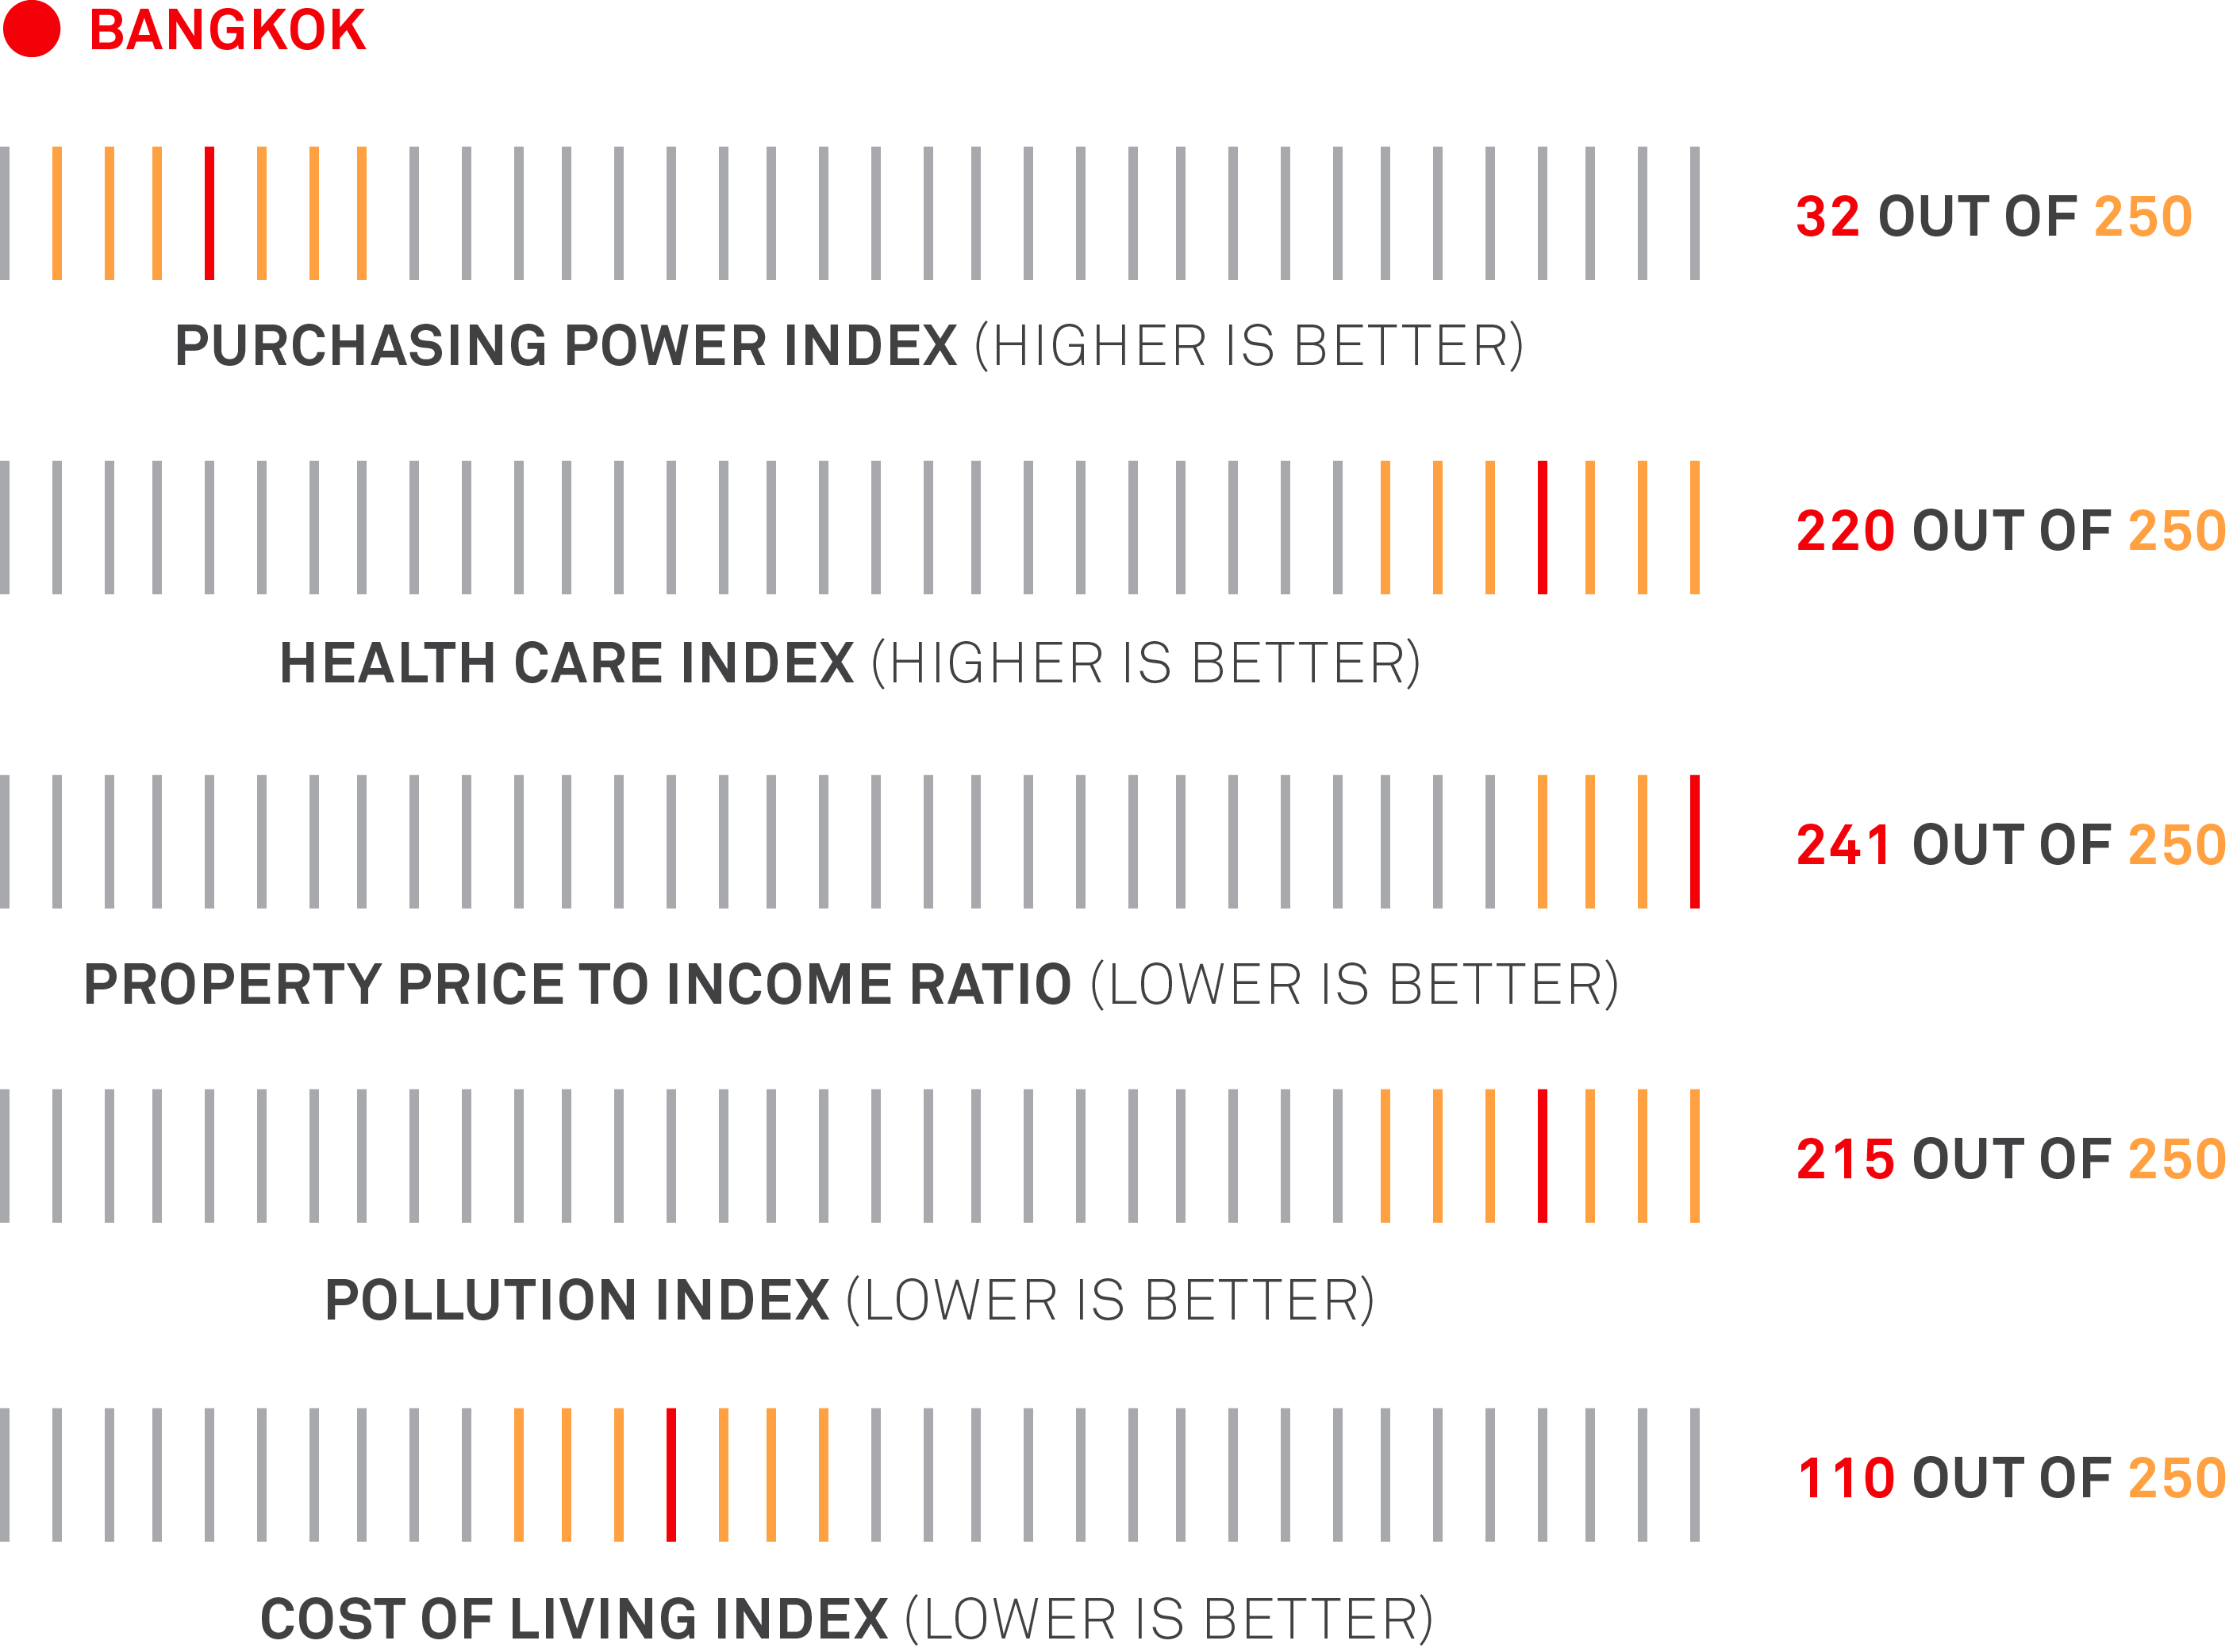
QUALITY OF LIFE INDEX (breakdown)

Quality of Life Index is an estimation of overall quality of life which takes into account purchasing power index, pollution index, house price to income ratio, cost of living index, safety index, health care index, traffic commute time index and climate index.

Graph showing Bangkok quality of life index

THAI AIRWAYS SENIOR EXECUTIVE ANNUAL SALARY

4065000 BHT
(128,636.93USD)

TAXI DRIVER ANNUAL SALARY

146000 BHT
(4,620.17USD)

As of January 2020, the average wage in Bangkok was 20,854 baht per month according to the National Statistical Office. Real wages in Thailand as a whole have dropped from 19,107 baht (604.64USD) per month in December 2016 to 15,337 baht (485.34USD) in December 2019.1“Average wage classified by industry (ISIC Rev.4) in Bangkok”, Bank of Thailand, National Statistical Office [March 12, 2020]; “Thailand – Real Wages & Salaries”, Moody’s Analytics [April 23, 2020].

SOURCES: numbeo.com, Thai Airways annual report 2018, Thailand Development Research Institute, globalpropertyguide.com

Beijing Index:

Cost of Living

2019 Rankings

MONTHLY UTILITY COSTS (prices in USD equivalent)

$60.84
Heat, electric, water, cooling, garbage 485 out of 589 (very low)
$12.92
Mobile data plan (20 gb) 368 out of 450 (very low)
$20.56
Home internet (200 mbps) 475 out of 589 (very low)

CLOTHING COSTS (prices in USD equivalent)

$69.46
One pair blue jeans (Levis or similar) 208 out of 584 (high)
$37.05
One summer dress (H&M or Zara equivalent) 266 out of 579 (moderate)
$85.84
One pair Nike shoes (Mid-range) 201 out of 587 (high)

THE BIG MAC INDEX 2019

47 %

In 2019, a McDonald’s Big Mac cost 21RMB in China and 5.74USD in the United States. The implied exchange rate for this price differential is 3.66. The difference between this and the actual exchange rate between the RMB and the USD in 2019, 6.88, suggests the Chinese yuan is 46.9% undervalued.1The Big Mac Index was invented by The Economist in 1986 as a lighthearted guide to whether currencies are at their “correct” level. It is based on the theory of purchasing-power parity (PPP), the notion that in the long run exchange rates should move towards the rate that would equalise the prices of an identical basket of goods and services (in this case, a hamburger) in any two countries.

Beijing 2019 Big Mac Index

COST OF A MCDONALD'S COMBO MEAL

35 RMB
(5.14USD)

APARTMENT PURCHASE PRICE PER SQUARE FOOT

9791.90 RMB
(1,437.71USD)

Graph showing apartment purchase price per square foot in Beijing

SOURCES: numbeo.com, China Mobile, The Economist, globalprice.info

Chengdu Index

Cost of Living

2019 Rankings

MARKETS (prices in USD equivalent)

$1.04
Apples (1 lb)
$0.33
Potatoes (1 lb)
$0.61
Water (12 oz bottle)
$11.81
Local cheese (1 lb)
$0.90
Domestic beer (.05 liter bottle)
$2.64
Cigarettes (20 pack Marlboro)

MONTHLY UTILITY COSTS (prices in USD equivalent)

$45.13
Heat, electric, water, cooling, garbage Global rank: 530 out of 592 (very low)
$0.14
1 minute mobile tariff (without plan) Global rank: 393 out of 454 (very low)
$15.43
Home internet (200mbps) Global rank: 474 out of 592 (very low)

CHENGDU MINIMUM WAGE PER MONTH

1780 RMB
(261.30USD)

CHINA MINIMUM WAGE COMPARISON INDEX

1 BEDROOM RENTAL VS PURCHASE GLOBAL RANKING

NUMBER OF FORTUNE 500 COMPANIES WITH A BRANCH IN CHENGDU

270

RANK AMONG BEST PERFORMING FIRST AND SECOND TIER CITIES IN CHINA

1

While experiencing such substantial economic growth, Chengdu is taking measures to protect the environment to prevent some of the congestion, pollution, and air quality issues faced by large eastern Chinese cities. The city has participated in partnerships with foreign cities aimed at exchanging knowledge and resources to help protect city green space and make progress on sustainability. Chengdu gained attention from the state of California for its efforts to curb pollution and climate change, earning a visit in 2017 from then-governor Jerry Brown. Chengdu remains forward thinking in this regard and others, making prospects for sustainable growth in Chengdu likely.1Milken Institute 2019 Report Best Performing Cities China

14.4
Population (Millions)
1.6
Manufacturing jobs (Millions)
$813.28
Average salary (USD) (Monthly after taxes)

SOURCES: numbeo.com, The Telegraph, Milken Institute, china-briefing.com, globallivingwage.org, ceicdata.com, globalpropertyguide.com

Ho Chi Minh City Index:

Cost of Living

2019 Rankings

MARKETS (prices in USD equivalent)

$0.85
One bottle domestic beer
$10.71
Bottle of wine (Mid-range)
$1.09
Cigarettes 20 pack (Marlboro or similar)

MONTHLY COST APARTMENT RENTAL (prices in USD equivalent)

$565.77
1 bedroom city center
$399.15
1 bedroom outside city center
$1,214.27
3 bedroom city center

INDICES COMPARISON INDEX

Ho Chi Minh City, Vietnam
vs.
Marseille, France

Consumer prices are 50% lower
Apartment rent prices are 21% lower
Restaurant prices are 71% lower
Grocery prices are 49% lower

COST OF ONE WEEK OF MOTORBIKE GASOLINE

81043.90 VND
(3.50USD)

SEMI-AUTOMATIC 110CC MOTORBIKE AVERAGE PURCHASE COST

6000000 VND
(258.00USD)

POLLUTION RATING

MOTORBIKE MAINTENANCE COSTS (prices in USD equivalent)

$3
Change tire tube
$6.50
Change engine oil and filter
$9
Repair cracked frame

HO CHI MINH POPULATION

8993082

NUMBER OF REGISTERED MOTORBIKES

7430000

SOURCES: numbeo.com, globalpropertyguide.com, General Statistics Office of Vietnam, anhwu.com

Jakarta Index:

Cost of Living

2019 Rankings

MARKETS (prices in USD equivalent)

$1.23
Apples (1 lb)
$0.41
Rice (1 lb white)
$5.23
Milk (1 gallon, regular)

MONTHLY UTILITY COSTS (prices in USD equivalent)

$101.31
Heat, electric, water, cooling, garbage
$0.13
1 minute mobile tariff (Without plan)
$27.09
Home internet (200 mbps)

TRANSPORTATION

$0.27
1-way ticket
$13.38
Monthly pass (Local rail)
$2.29
Gasoline (1 gallon)
$0.45
Taxi start cost (Normal tariff)
$0.48
Taxi 1 mile (Normal tariff)
$2.81
Taxi 1 hour waiting (Normal tariff)

TRAFFIC INDEX GLOBAL RANKING (2019)

Traffic Index is a composite index of time consumed in traffic due to job commute, estimation of time consumption dissatisfaction, CO2 consumption estimation in traffic and overall inefficiencies in the traffic system.

Graph showing traffic index global ranking of Jakarta in 2019

NO. OF PEOPLE ORDERING TRANSPORT, FOOD AND OTHER RIDE SERVICES

Graph showing number of people ordering transport, food and other ride services in Jakarta

SOUTHEAST ASIA RIDE HAILING SECTOR ESTIMATED MARKET CAP

193.6 Trillion IDR
(13 Billion USD)

INDONESIA E-COMMERCE ESTIMATED MARKET CAP BY 2025

1.22 Quadrillion IDR
(82 Billion USD)

Just over a decade ago, almost four in five Southeast Asians had no internet connectivity and limited access to the internet. Today, Southeast Asians are the most engaged mobile internet users in the world. There are 360 million internet users in the region, and 90% of them connect to the internet primarily through their mobile phones. Powered by these fundamental changes in consumer behavior, the internet economy continues to grow at an unprecedented pace. It has soared to $100 billion for the first time in 2019, more than tripling in size over the last four years. e-Commerce and Ride Hailing continue to beat the most optimistic of predictions. Online Media and Online Travel keep growing at a steady rate, with ample room to expand further. By 2025, the internet economy is expected to grow to $300 billion.1Google’s “e-Conomy SEA” is a multi-year research program launched to shed light on the Internet economy in Southeast Asia. It covers the six largest markets in the region: Indonesia, Malaysia, the Philippines, Singapore, Thailand and Vietnam. The 2019 report covers five key sectors of the Internet economy: Online Travel (Flights, Hotels, Vacation Rentals); Online Media (Advertising, Gaming, Subscription Music and Video on Demand); Ride Hailing (Transport, Food Delivery); e-Commerce; and Digital Financial Services (Payments, Remittance, Lending, Investment, Insurance).

SOURCES: numbeo.com, globalpropertyguide.com, Google e-Conomy SEA 2019 Report, tradingeconomics.com

Mumbai Index:

Cost of Living

2019 Rankings

Transportation

$0.27
1-way ticket (Local rail)
$5.44
Monthly pass (Local rail)
$4.11
Gasoline (1 gallon)
$0.30
Taxi start cost (Normal tariff)
$0.48
Taxi 1 mile (Normal tariff)
$1.36
Taxi 1 hour waiting (Normal tariff)

Proposed Transport Infrastructure by 2031

435
Kilometers metro rail (270 miles)
1740
Kilometers highway network (1082 miles)
248
Kilometers suburban rail (154 miles)

Monthly Living Costs for Single Person Without Rent

28353.12 IND
(385.65USD)

Monthly Living Costs for Family of Four Without Rent

99334.86 IND
(1,351.13USD)

1 Bedroom Rent per Month / Global Ranking

Apartment Purchase Price per SQ FT / Global Ranking

Average Yearly Mortgage Interest Rate for 20-Year Fixed

8.90 %

SOURCES: numbeo.com, Maha Mumbai Metro, globalpropertyguide.com, worldbank.org

Seoul Index:

Cost of Living

2019 Rankings

RESTAURANTS (prices in USD equivalent)

$6.56
Meal for 1 (Inexpensive restaurant)
$32.82
Meal for 2 (Mid-range, three-course)
$5.42
Meal at McDonalds (Or equivalent combo meal)
$3.28
Domestic beer (1 pint draught)
$3.99
Cappuccino (Regular)
$0.79
Water (12 ox small bottle)

MARKETS (prices in USD equivalent)

$7.98
Milk (Regular, 1 gallon)
$2.14
Loaf of fresh white bread (1 lb)
$2.80
Eggs (Regular, one dozen)
$3.14
Apples (1 lb)
$16.41
Wine (One bottle mid-range)
$3.69
Cigarettes (20 pack Marlboro)

LOCAL PURCHASING POWER IN SEOUL COMPARED TO NEW YORK CITY

24.73 %

You would need approximately 5,763.75$ (6,715,864.82WON) in Seoul to maintain the same standard of living that you can have with 10,000USD in New York City. This assumes net earnings after income taxes and apartment rentals in both cities.

INDICES COMPARISON INDEX

Seoul, Korea
vs.
New York City, USA

Consumer prices
Seoul is 22.82% lower
Apartment rent prices
Seoul is 70.58% lower
Restaurant prices
Seoul is 60.94% lower
Groceries prices
Seoul is 5.56% lower

SOURCES: numbeo.com, globalpropertyguide.com

Singapore Index:

Cost of Living

2019 Rankings

WORLD RANKING

#6
Most expensive fitness club (Monthly fee for 1 adult) out of 589 cities in the world
#15
Most expensive apartment (Rental 1br city center) out of 589 cities in the world
#14
Most expensive apartment (Rental 3br city center) out of 589 cities in the world

SOUTHEAST ASIA RANKING

#1
Most expensive rice (White, 1kg) out of 24 cities in Southeast Asia
#1
Most expensive fitness club (Monthly fee for 1 adult) out of 24 cities in Southeast Asia
#1
Most expensive apartment (Rental 1br city center) out of 24 cities in Southeast Asia

VOLKSWAGEN GOLF 1.4 TRENDLINE MODEL COST

158177.63 SGD
(115,400.07USD)

RANGE ROVER SPORT 5.0 V8 MODEL COST

610999 SGD
(445,760.43USD)

About 12% of Singapore’s total land area is roadway. Before you are allowed to purchase a car, prospective buyers have to first bid for a Certificate of Entitlement (COE), which for a mid-sized sedan can total up to SGD$41,600 (US$30,600). Additional taxes are added, which means costs can add up to more than the open market value of the car itself. The average cost of a compact car is approximately SGD$105,929 (US$77,670). The industry’s premium pricing is part of the government’s plan for a “car-lite” Singapore, as limited space challenges city planners.

VOLKSWAGEN GOLF 1.4 TRENDLINE MODEL COST - GLOBAL RANKING

Most expensive

Singapore
87,795USD
Iran
55,000USD
Vietnam
42,836USD
Denmark
40,017USD
Israel
38,581USD

Least expensive

Georgia
12,000USD
Pakistan
12,032USD
India
12,236USD
Paraguay
13,748USD
Kenya
14,758USD

AVERAGE MONTHLY SALARY AFTER TAXES

4892.59 SGD
(3,569.44USD)

SOURCES: numbeo.com, sgcarmart.com, cnn.com, nationmaster.com, globalpropertyguide.com

Taipei Index:

Cost of Living

2019 Rankings

Markets (prices in USD equivalent)

$11.98
Milk (1 gallon, regular)
$1.49
White rice (1 lb)
$2.53
Eggs (1 dozen)
$10.51
Local cheese (1 lb)
$2.24
Apples (1 lb)
$0.71
Water (12 oz bottle)
$1.40
Tomato (1 lb)
$4.43
Chicken Fillets (1 lb)
$15.50
Bottle of Wine (Mid-range)
$3.84
Gasoline (1 gallon)
$0.92
Coke / Pepsi (12 oz bottle)
$4.13
Cigarettes (20 pack Marlboro)
$78.77
1 pair jeans (Levis, etc.)
$91.90
1 pair Nike running shoes (Mid-range)
$33.81
1 summer dress (H&M, Zara, etc.)

Cost of Living Global Rank (out of 571 total cities)

251

Cost of Living Index Global Ranking (2019)

1 Bedroom Apartment Monthly Rental in City Center

17354.84 NT$
(597.65USD)

Average Monthly Net Salary After Taxes

46969.18 NT$
(1,617.48USD)

SOURCES: numbeo.com, globalpropertyguide.com

Tokyo Index:

Cost of Living

2019 Rankings

World Ranking

#4
Most expensive fitness club (Monthly fee for 1 adult) out of 467 cities in the world
#10
Most expensive cinema ticket (International release 1 adult seat) out of 467 cities in the world
#29
Most expensive men's leather business shoes (One pair) out of 467 cities in the world

Asia Ranking

#1
Most expensive men's leather business shoes (One pair) out of 102 cities in Asia
#2
Most expensive basic utilities for an 85 sq meter apartment (Electric, heating, cooling, water) out of 102 cities in Asia
#1
Most expensive one minute of mobile tariff local (No discounts or plans) out of 102 cities in Asia

Eastern Asia Ranking

#1
Most expensive men's leather business shoes (One pair) out of 12 cities in Eastern Asia
#1
Most expensive apples (1kg) out of 12 cities in Eastern Asia
#1
Most expensive cinema (One adult seat) out of 12 cities in Eastern Asia

Apartment purchase price per square meter

1238513.97 ¥
(11,796.24USD) 1BR in city center

In Tokyo Metropolitan Area, existing condominiums ́ average price rose by 4.73% during 2019, up from 0.9% the previous year. However the average price of new condos in Tokyo fell by 2.67% in 2019 (-3.43% inflation-adjusted), after a 0.23% decline the previous year. The big surprise was that during the latest quarter, new condo prices plunged by 8.11% (-8.46% inflation-adjusted). Existing condominium sales in Tokyo rose by 2.4% y-o-y in 2019 while existing detached house sales increased 4.5%.

Rent per Month

1 bedroom apartment

Ginza
128,767.86¥(1,218.53USD)
Ometesando
112,042.55¥(1,060.26USD)
Shinjuku
103,126.24¥(975.88USD)
Ebisu
88,478.31¥(837.27USD)
Shinagawa
79,854.82¥(755.67USD)

3 bedroom apartment

Ginza
428,767.86¥(4,057.43USD)
Ometesando
412,042.55¥(3,899.16USD)
Shinjuku
403,126.24¥(3,814.78USD)
Ebisu
388,478.31¥(3,676.17USD)
Shinagawa
279,854.82¥(2,648.27USD)

SOURCES: numbeo.com, globalpropertyguide.com